
W.E.B. Du Bois: visionary civil rights activist and unswung hero of data visualisation
By Filipe Zuluaga on Wednesday 12 October 2022
I recently came across this beautifully designed exploration of some of W.E.B. Du Bois’ visionary data visualisations from 1900, showcasing the progress made by Black Americans after emancipation as well as the challenges they still faced.
As I was admiring the different charts, tables and maps I realised they were a perfect example of how their author had lived up to this year’s Black History Month theme of enacting change by action and not only words: W.E.B. Du Bois viewed this sociological work as an opportunity to counter the false and racist ideas behind Social Darwinism, by presenting statistical data showing how far the African American community had advanced in the (then) short period since the abolition of slavery.
But before I delve deeper into the project, let’s step back and provide a bit of context. William Edward Burghardt Du Bois, better known as W.E.B. Du Bois, was born in 1898 in Massachusetts, USA, son of a domestic worker and a barber and itinerant labourer. In addition to his contributions to the field of data visualisation, he is one of the most prominent US Black civil rights activist, a celebrated scholar, editor and sociologist. He was the first African American to earn a doctorate, graduating from Harvard and then becoming professor of history, sociology, and economics at Atlanta University. Throughout his life he fought prejudice and racism, using rigour, data and eloquence to speak out against oppression and calling for equal rights. He was the only Black founder of the civil rights group the National Association for the Advancement of Coloured People (NAACP) in 1908 and was a key figure in establishing Pan-African Congresses at the turn of the century. His support for the end of colonialism earned him the admiration of many African leaders, leading to an invitation by President Kwame Nkrumah to move to Ghana, which he did in 1961 when he was 93 years old. He died two years later, shortly after becoming a Ghanaian citizen. His most famous book, The Souls of Black Folk, published in 1903, is a collection of essays on race, work and culture that criticised the (then) more prevalent policy of political conservatism and racial accommodation promoted by Booker T. Washington. Equally significant were the more than 60 data portraits he created in 1900, which were the first and some of the most sophisticated quantitative research ever done on race and the Black population, establishing Du Bois as a designer, narrator and curator of Black culture.
A request to contribute a social study about African American life to the Exposition Universelle, the Paris World Fair of 1900 sparked this project. This was a time when human zoos displaying people from colonised nations were still common in fairs like this one and Du Bois sought to challenge such practices and views. He included the infographics as part of an Exhibit of American Negroes, calling it “an honest straightforward exhibit of a small nation of people, picturing their life and development without apology or gloss, and above all made by themselves.”
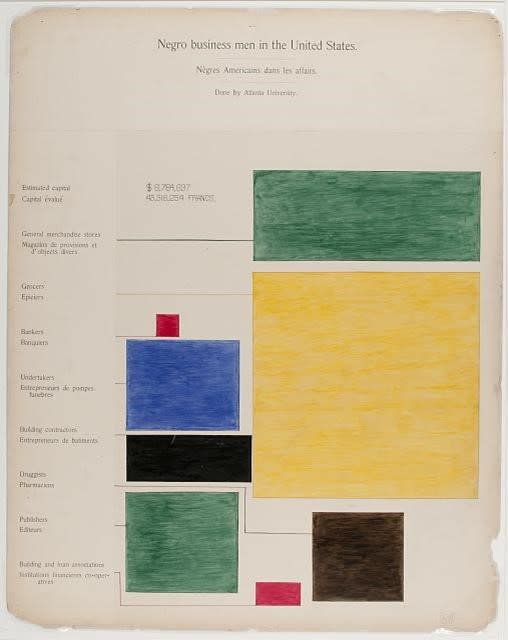
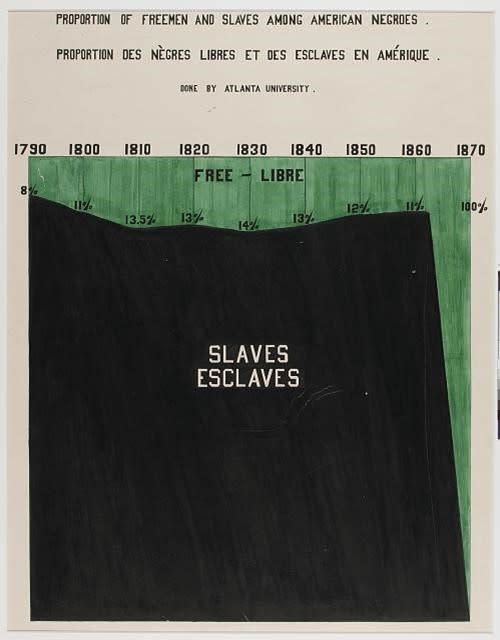
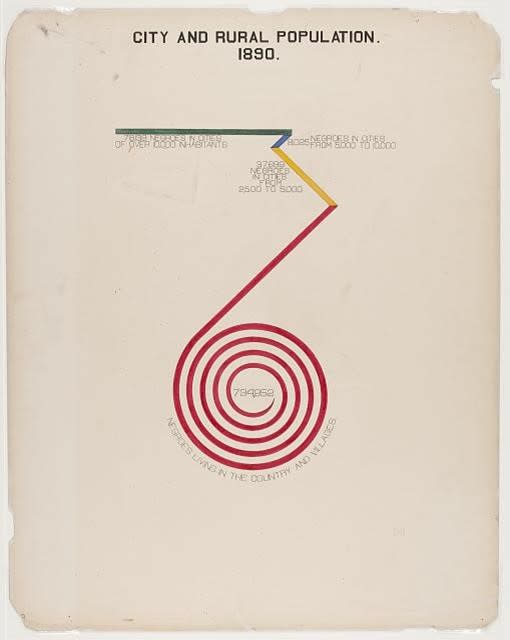
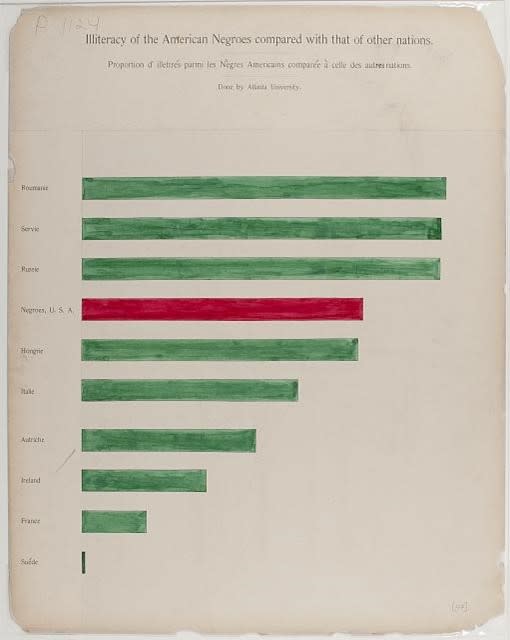
The show included a selection of hundreds of photographs that presented a more rounded view of what life was like for Black Americans. Still, the images alone were not enough to show both how far the Black community had come in less than 50 years and the many ways in which the legacy of slavery and institutional racism were holding Black Americans back. So, Du Bois, together with a team of students and alumni, started putting together a series of data portraits that would bring into focus in vibrant and modern graphics the social and intellectual achievements of Black America. Using a range of striking visual and design techniques that mix conventional choices (such as bar and area charts) with more innovative formats such as “coxcomb” diagrams and spiral bars, Du Bois created a narrative of progress that included indicators for property ownership, population growth, rising employment and improving literacy rates, as wells as other metrics of social improvement.
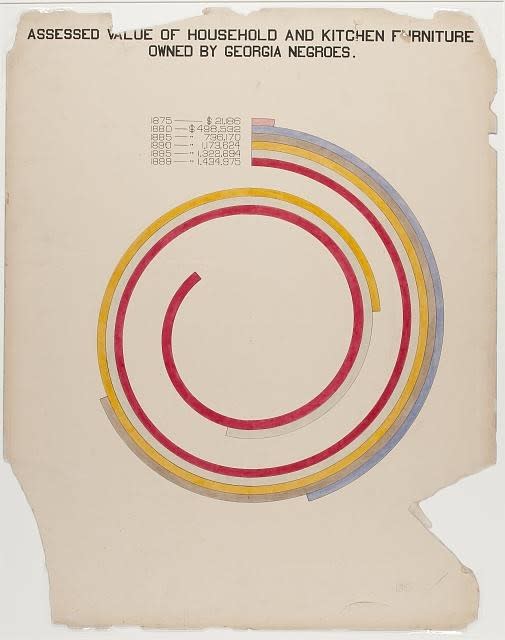
All the illustrations are beautifully drawn by hand and have impeccable statistical accuracy drawn from using reliable sources such as the U.S. Census data, the U.S. Bureau of Labor statistics and various government reports. The infographics were designed to stand out and tell a nuanced and complex story of how Black Americans hadn’t progressed because of the country they lived in, but rather were prospering despite of it. Du Bois and his team were also mindful of the international setting where the work was being presented, so they sought to make comparisons that countered inaccurate stereotypes and perceptions. The graphics illustrated how, for example, Black Americans had higher marriage rates than Germans, an older population than the French and were more literate than the Russians or Romanians.
The exhibit received extensive praised, with the judges awarding Du Bois a gold medal for his role as compiler of the materials presented. It received accolades in the African American press, but generated little interest in European media and almost none in mainstream publications in America.
When the tour was finished, the materials were archived by the US Library of Congress, where they stayed in relative obscurity until the Library digitised them, making the pioneering work available to a whole new audience. The recent rise in interest in data visualisation has propelled Du Bois’ work to the level of fame and recognition it rightfully deserves, inspiring many to use innovative ways to visualise the many inequalities in modern society and paving the way to make meaningful change happen.
Sources:
•https://public.tableau.com/app/profile/chimdi.nwosu/viz/W_E_B_DuboisPortraitGallery/MainGallery
• https://nightingaledvs.com/spotlight-w-e-b-du-bois-portrait-gallery/
• https://www.loc.gov/pictures/collection/anedub/item/2014645363/
• https://hyperallergic.com/306559/w-e-b-du-boiss-modernist-data-visualizations-of-black-life/
• https://www.liverpool.ac.uk/black-atlantic/information/w.e.b._dubois/


